


Candlestick patterns are important for the understanding market trends and price movements. They are, in fact, the base of technical analysis. If one can take the time to carefully examine the candlestick patterns, then it is possible to predict future reversals, continuations, or consolidations. The guide here explores how the candlestick chart patterns form and strategies for making informed decisions for traders.
Table of Contents
What are Candlestick Charts?
Candlestick charts are another widely used tool of financial charting in technical analysis, giving a graphic interpretation of the asset’s prices over a specific period of time. It has roots in Japan, in the 18th century, first used for analyzing rice price trends and later used widely as a basis for modern trading.
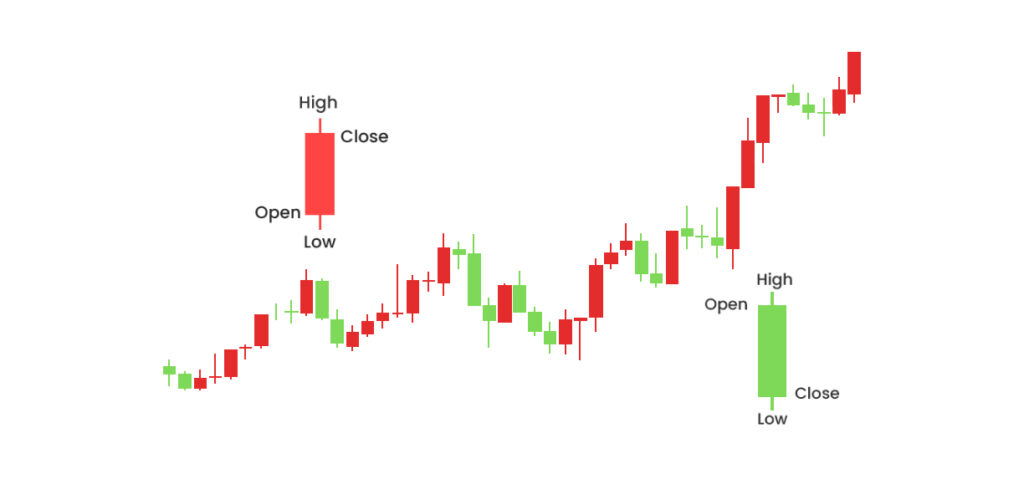
Each candlestick depicts four vital information items for that period:
- Open Price: It is the opening price when the trading session began.
- Closing Price: The price as the trading session closed.
- High Price: The high price reported in the session.
- Low Price: The lowest price realized in the session.
Structure of a Candlestick
A candlestick is essentially made of two major parts :
- The Body: It shows whether the opening price is higher or lower than the closing price. A filled or colored body will generally indicate a bearish movement, while a hollow or differently colored body indicates a bullish movement.
- Wicks or Shadows: Those thin lines are drawn out both above and below the body marking the high and low within the session.
Advantages of Using Candlestick Charts
- Visual Clarity: Candlestick charts provide an explicit view of market trends and price actions.
- Pattern recognition: There are particular candlestick patterns, such as the bullish, bearish, single, and multiple candlestick patterns, which can indicate probable reversals or continuations of trends.
- Market Sentiment: The color and shape of the candlesticks indicate whether buyers or sellers dominated during the period.
How Candlestick Charts Help Traders
- They give a very timely indication of the market mood and direction.
- They forecast potential market reversals or continuation and also points of indecision.
- Traders often combine candlestick charts with other technical indicators like moving averages, RSI, or Fibonacci retracement, for instance-for more precise trades.
Mastering candlestick charts will help traders have deeper insight into price behavior and thus better refine their trading strategies and improve decision-making in the various financial markets.
How do candlestick patterns form?
This type of candlestick formation evolves from the movements within a given timeframe under the market. Movements are all recorded with the use of four main data points: open, high, low, and close prices. By integrating all four data into one unit, known as a candlestick, their resulting patterns show the behaviours occurring in the market, trends, and even feelings it may have towards further developing trends.
Major Contributing Factors in the Formation of Candlestick Patterns:
- Price Action:
- The interaction between buyers and sellers determines whether the session ends bullish (closing price higher than opening) or bearish (closing price lower than opening).
- Sudden shifts in buying or selling pressure create patterns that signal reversals, continuations, or market indecision.
- Time Span:
- Candlestick patterns can occur on a wide range of time frames from 1-minute charts up to daily or weekly charts. The same pattern might carry a different message on a different time frame.
- Market Sentiment:
- This patterns would indicate the psychology of a trader- that he might be greedy, fearful, or indecisive.
- Example : Hammer pattern may suggest that the price did recover some initial selling pressure and a Shooting Star indicates huge selling in strong domination by sellers following a spike.
- Parts of a Candlestick
- It reflects the difference between the opening and closing prices.
- Wicks/Shadows: Mark the highest and lowest price that traded during the period.
- The length and the position of the body and wicks are the influences to interpret the candlestick.
Types of Candlestick Patterns
Candlestick patterns are among the most important tools for technical analysis, which is the basis for getting market sentiments, trend direction, and probable reversals. They provide a way for the traders to gauge market psychology and make short-term predictions on the price movements. Bullish Candlestick Patterns signify dominance by the buyer and the price is going upwards while Bearish Candlestick Patterns indicate seller’s dominance, suggesting potential declines. These can be broadly categorized into Single Candlestick Patterns and Multiple Candlestick Patterns, which offer unique insights into market behavior and potential price action.
Bullish Candle Patterns
Bullish Candlestick Patterns indicate that buyers are in control; that is, the price can go upward. There are two types: Single Candlestick Patterns and Multiple Candlestick Patterns. And both have very important importance for a trader.
1. Bullish Single Candle Patterns
Hammer Candlestick Pattern:
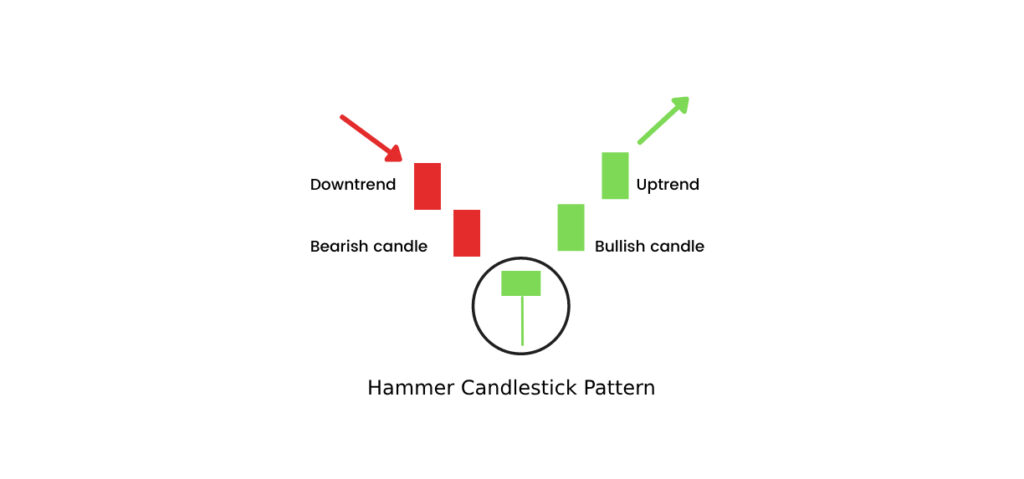
This Hammer Candlestick Pattern is the most important bullish reversal signal that tends to appear towards the end of a downtrend. It has been uniquely shaped to denote the trend having reversed from selling pressure to buying momentum, hence, it is very significant for traders in detecting the possibility of reversals in trends.
Characteristics of the Hammer Pattern:
- Smallest: Places almost near to candle high side which shows a very minimal or very tight range between an open and close price.
- Long Lower Wick: This wick is at least twice the size of its body, so sellers pushed this price lower but the buyer gaining control and reversing it.
- Minimal Upper Wick: The little or minor length which gives a minimal resistance above the closing price.
Interpretation:
The Hammer shows that the selling pressure in a downtrend has eased significantly because the buyers have come in to push the price higher by close. Often, this pattern is a sign for traders to look for a potential upward price reversal.
Example:
- Scenario: After a long downtrend, a Hammer forms, and the price closes near the session’s high. This can be interpreted as the end of the downtrend, and traders may go long if the pattern is confirmed by subsequent bullish movement or increases in volume.
Key Notes:
- Confirmation is key: Watch out for a strong bullish candle after the Hammer to confirm a reversal.
- Context makes the signal believable. It makes sense in terms of rising volume.
Recognizing and understanding the Hammer Candlestick Pattern will enable a trader to have an invaluable edge in anticipating market reversals and planning entry points in the right manner.
Inverted Hammer Candlestick Pattern
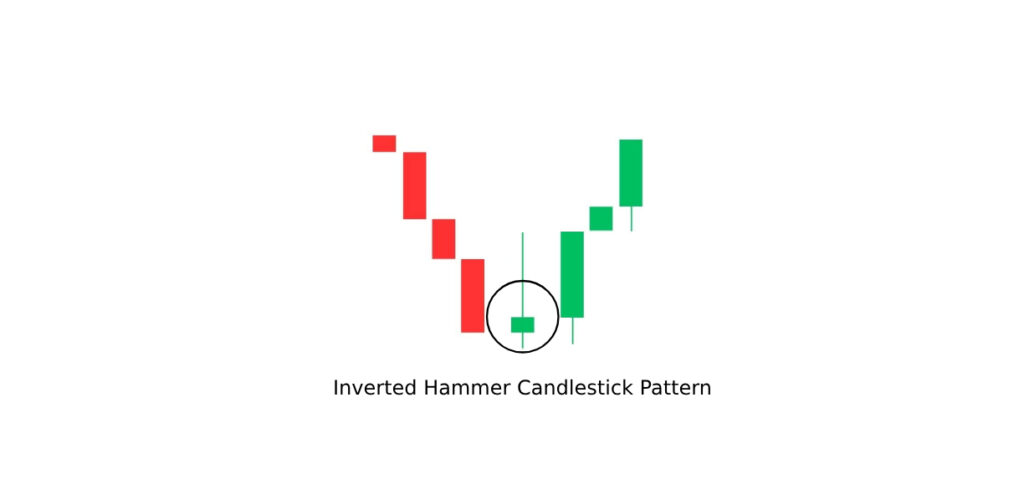
The Inverted Hammer Candlestick Pattern is a bullish reversal indicator. It is often seen after the downtrend. Its shape is very unique and symbolizes the possibility of changing the market’s mood and can be very useful for traders seeking bottoming patterns.
Characteristics of the Inverted Hammer Pattern:
- Small Real Body: It is placed near the lower end of the candlestick, indicating a small difference between the opening and closing prices.
- Long Upper Wick: Longer than double body in length indicating that buyers are trying to pump the price upward during that time.
- Minimal Lower Wick: Extremely rare or just a small one; hardly any lower movement from the open price.
Interpretation:
The Inverted Hammer indicates that after a long downtrend, buyers are beginning to take control, forcing the price higher in the session. Although sellers may have been able to push the price lower by the close, the fact that there is buying pressure suggests a potential reversal to the upside.
Example:
- Scenario: A continuation pattern with a trend of downward continuation followed by an Inverted Hammer, where the body is small and near the low, but the upper shadow is very long, hints that the market might begin gearing up for a reversal to the upside. The pattern usually goes with confirmation in the form of a strong bullish candle or increased volume.
Key Points:
- It’s time to confirm: A Bullish candlestick after the Inverted Hammer is needed to authenticate this pattern and confirm the price reversal.
- Market Context: This pattern is most trusted if it forms at the end of a downtrend and also backed by other technical indicators or increased trading volume.
The traders could look at Inverted Hammer Candlestick Patterns so that they are ready in anticipating bullish reversals to adapt and align their strategy towards uptrend price action.
Doji Candlestick Pattern:
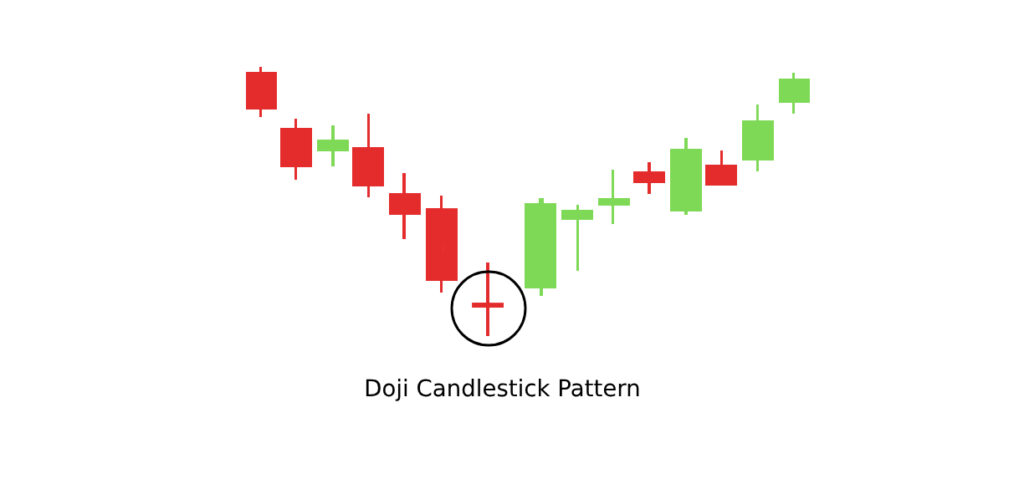
Doji Candlestick Pattern is another highly significant single candlestick pattern that indicates that the market is indecisive or at equilibrium between the buyer and seller. Bull patterns, when there exists an existing downtrend, then showing a Doji pattern at its end indicates it may reverse and the initiation of an upward price movement.
Character traits of a Doji Pattern:
- Very small or no real body: Open and close prices are almost identical, so the body is extremely narrow.
- Long or Short Wicks: The upper and lower shadows can be of different lengths, depending on the volatility of price movement within the session.
- Neutral Look: The pattern itself does not seem to point in any particular direction but does give out a warning of a probable change.
Bullish Implications:
If the Doji occurs at the end of a downtrend, then this represents that selling pressure is dwindling and buyers are going against the trend. Now, if a strong bullish candlestick follows the Doji, then this simply confirms the reversal and may call for an upward move.
Types of Doji Patterns in Bullish Contexts:
- Dragonfly Doji: Features a long lower wick with no upper shadow, indicating strong buying pressure near the session’s close.
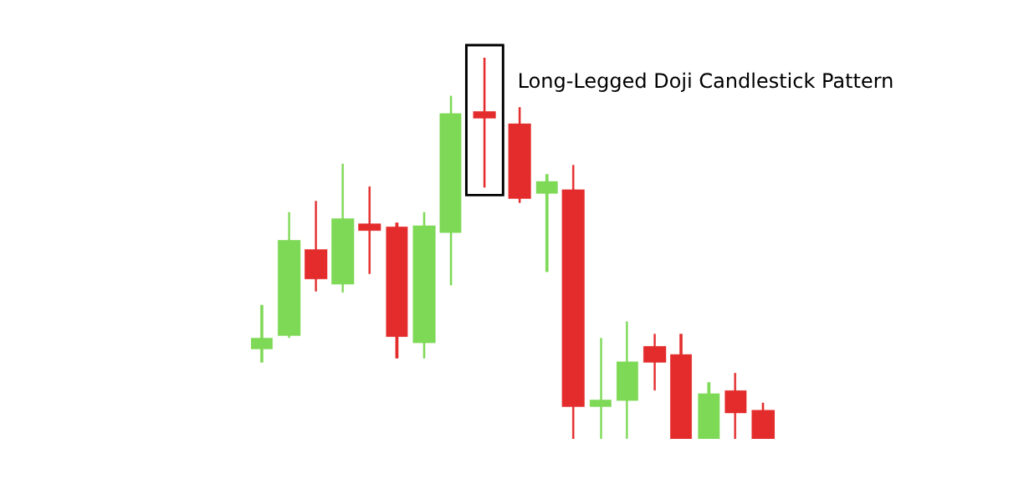
- Long-Legged Doji is long upper and lower wicks, high volatility in the market with a possible reversal to a bullish price if confirmed.
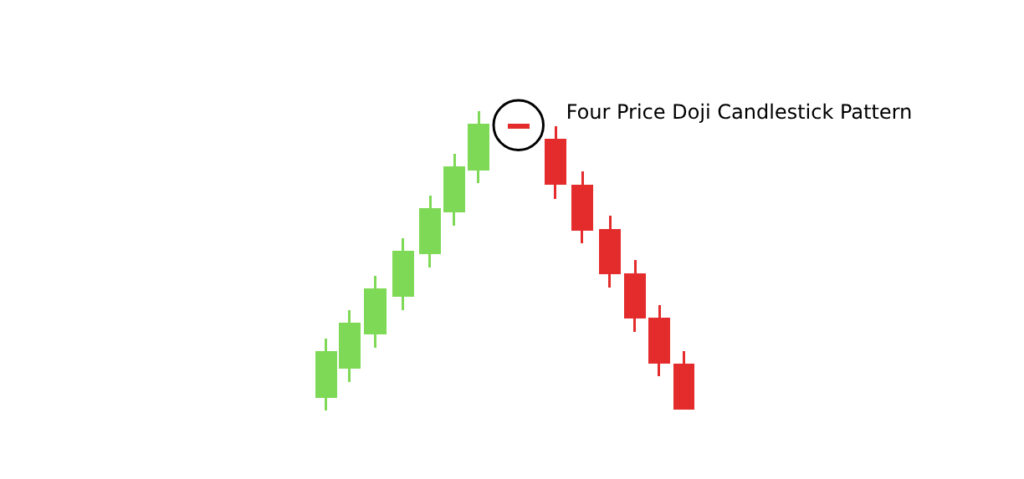
- Four-Price Doji- Occasionally formed, where prices of open, high, low, and close are all equal so indicative of temporary pause or indecision in market actions.
Example:
- Scenario: After a downtrend, a Dragonfly Doji has occurred with a long lower wick. The next candle is bullish with increased volume thus confirming the reversal. Therefore, in this pattern of the setup, the buyers will have the opportunity.
Key Considerations:
Confirmation is Essential: Wait for the candlestick in the next following session to confirm the reversal signal.
Market Context: A Doji pattern must be used with other technical indicators to determine the appropriate analysis.
Identification of Doji Candlestick Pattern in a downtrend helps traders foresee potential bullish reversals and strategically position themselves for potential up-sides.
Dragonfly Doji Candlestick Pattern
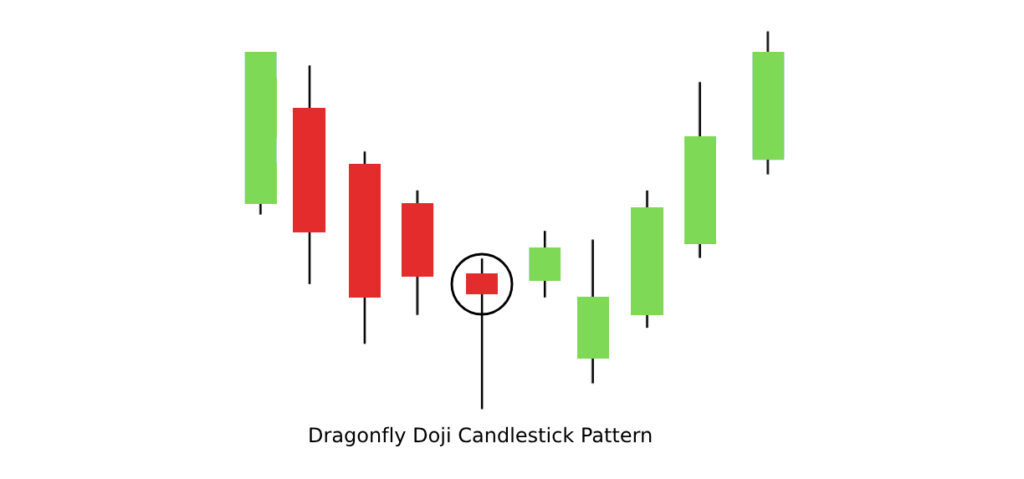
The Dragonfly Doji Candlestick Pattern is a solitary bullish single candle formation that usually suggests the reversal of a downtrend. That means sellers had pushed the price lower during the trading session but buyers took control and sent the price back to the opening point.
Main Character Features for Dragonfly Doji
- No Upper Wick: This lack of, or thin, upper shadow suggests buyers dominated the end of the session.
- Long lower wick: A long lower shadow suggests that selling pressure was very strong, but it was overcome by strong buying interest.
- It has its open and close prices at or near the session’s high, therefore it appears like a horizontal line on top of the candlestick.
Bullish Implications:
The Dragonfly Doji is thought of as a reversal signal when it occurs in a downtrend. It shows that the market has rejected the lower prices and buying interest has started to pick up. If a bullish candle follows the Dragonfly Doji, then the reversal gets confirmed and increases the potential for upward price movement.
Example:
- Scenario: During a bearish trend, a Dragonfly Doji forms showing sellers forcing the price down early, but buyers regaining control by the session close. The next candlestick was bullish with higher volume that validated the reversal.
How to Trade the Dragonfly Doji:
- Confirmation is Key: Always wait for a bullish candlestick to follow the Dragonfly Doji before entering a trade.
- Higher probability level: Support Levels: Take the Dragonfly Doji near a strong support level for more accuracy.
- Combine with Indicators: Use RSI, MACD, or other technical indicators to validate the strength of the potential reversal.
This is perhaps the most reliable indicator any trader may apply towards marking a bull reversal within a falling market trend. That occurs when, on breaking, it gets further cemented by future price, which lets a trader finally get to know which course he should adopt while fine-tuning his strategy accordingly.
Spinning Top Candlestick Pattern
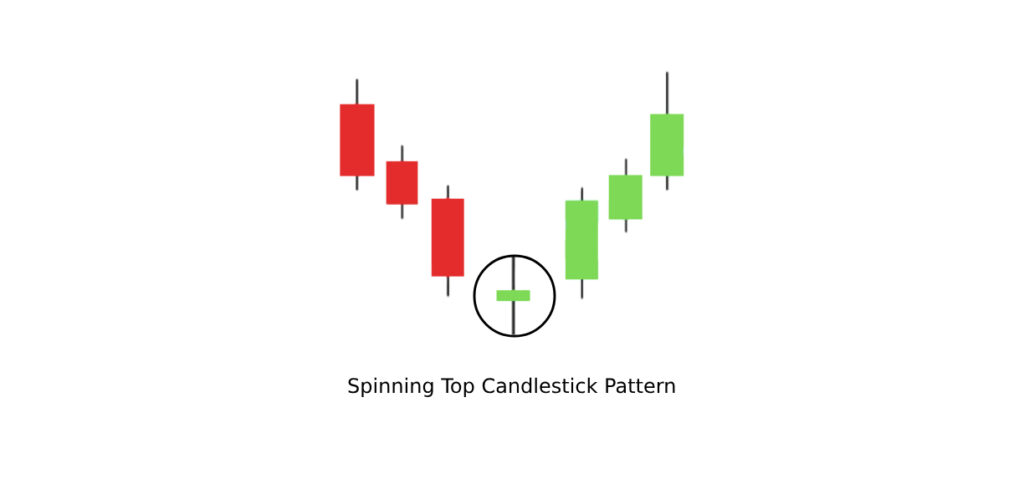
The Spinning Top Candlestick Pattern is a single candlestick formation that reflects market indecision where neither buyers nor sellers have a decisive control during the trading session. It appears in both bullish and bearish contexts, but the Spinning Top often signals a potential trend reversal or consolidation, especially when it occurs in a bullish scenario.
Characteristics of the Spinning Top:
- Small Body: The candlestick body is small, hence the proximity of opening and closing prices. This also suggests indecision at the market level.
- Long Shadows: The upper and lower shadows (wicks) are quite long relative to the small body. This suggests that both buyers and sellers gained control at different times in the session but could not push the price significantly higher or lower.
- Indecision: The tiny body and long shadows would suggest a balance between selling and buying pressure, in which the market is uncertain about what to do.
Bullish Implications:
- Trend Reversal Signal: A Spinning Top in a downtrend is a signal that the selling momentum is weakening, which might bring about a reversal and uptrend.
- Consolidation: If found in an uptrend, the Spinning Top may be a consolidation or indecision period but is likely to continue in an uptrend if followed through by a strong bullish candlestick.
Example:
- Scenario: When in a downtrend, a Spinning Top is formed close to a support level, then a bullish candlestick. This pattern hints that perhaps the buyers might be able to gain ground over sellers, and this might eventually help turn things around for the upside.
- Confirmation: Following the Spinning Top, the next trade usually expects a bullish candle with more volume to confirm the reversal.
How to Trade the Spinning Top:
- Context Matters: The more relevant a spinning top is if it appears by significant support or resistance lines.
- Wait for Confirmation: Always wait for the next candlestick to confirm the direction of the trend. A bullish candle after a Spinning Top in a downtrend increases the likelihood of a reversal.
- Volume Analysis: The more volume a confirmation candle has, the greater potential for reversal.
The Spinning Top Candlestick Pattern is something one should know, for it depicts indecision within the market. This particular pattern could predict reversals, especially in a downtrend, and confirmation of such is quite vital. For this particular pattern, there is always a possibility for better decision-making, following the observation in subsequent candles of context and volume.
Long-Legged Doji Candlestick Pattern
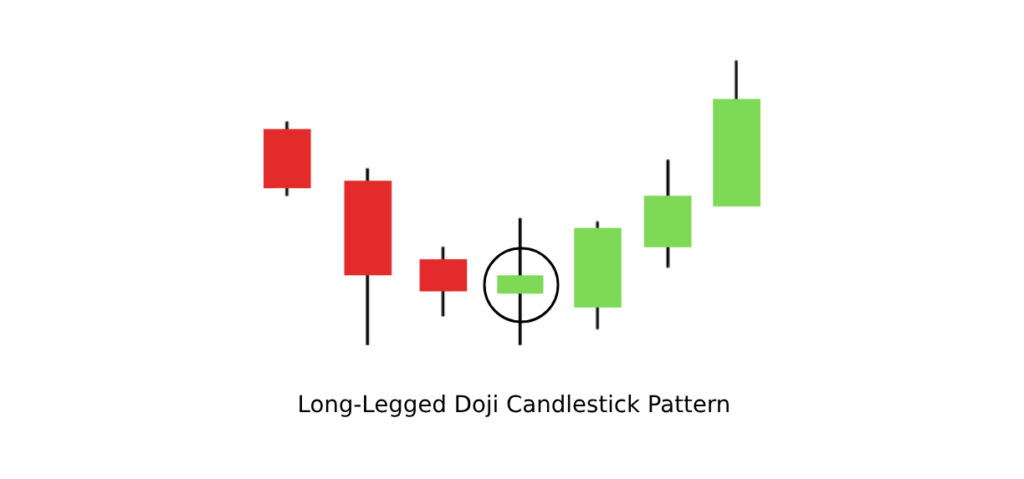
One of the forms that a regular Doji produces is the Long-Legged Doji. In candlesticks, this form has a long length up and down for the shadow above and below it. Normally, its body is at a small level. Sometimes, there is not even a small body, so that nothing exists other than the formation of its shadows.
Characteristics of the Long-Legged Doji:
- Small Body: The Long-Legged Doji is very much like the standard Doji, but the opening and closing prices are near each other in a small body, which shows the indecision in the market.
- Long Shadows: The Long-Legged Doji is characterized by the long upper and lower shadows. This is a sign that both the buyers and sellers were very active during the session but neither could gain the upper hand.
- Market Uncertainty: The pattern seems to indicate that there has been a great fight between buyers and sellers, but the market has not decided and made a move by the end of the session.
Bullish Implications:
- Reversal Signal in the Down Trend: A long legged Doji can also be interpreted in this case as a reverse sign during a downtrend. It simply shows a length of shadows, indicative that strong selling pressures cannot overcome the buyers anymore, thereby making it reverse.
- Market Indecision Prior to Reversal: This is a indecision pattern, but if it does appear during a downtrend and then followed up with a bullish candle maybe it’s almost time for the market to reverse.
- Potential Trend Continuation: Long-legged Doji in an uptrend may indicate a slight reversal or consolidation. Once the market decides what it wants, a more powerful bullish candle can indicate a continued trend.
Example:
- Scenario: A Long-Legged Doji appears at the bottom level after a long downtrend. In this case, if there happens to be a Bullish candle following it, then one can assume that buyers take over control, and the prices are likely to be reversed upwards.
- Confirmation: Like all the other candlestick patterns, this also awaits confirmation at the next candle. An upbeat candle that appears after Long-Legged Doji gives more weight to this reversal signal.
How to Trade Long-Legged Doji
- Wait for Confirmation: The Long-Legged Doji itself is an indication of indecision. Wait for a confirmation candle, preferably a bullish one, before acting on a reversal.
- Volume Analysis: Check if there is an increase in volume when confirming the reversal with the candle. More volume means strong buy interest and confirms a likely change in trend.
- Support and Resistance Levels: This pattern is more reliable when it forms near significant support or resistance levels, as these areas often influence the market’s next move.
One of the strong indicators for market indecision pand ossible reversal is the Long-Legged Doji. It must be confirmed by the next candlestick, usually coming along with the volume analysis. It is in applying the Long-Legged Doji together with other technical tools that will be used for an analysis how a trader will better make a trading decision while operating under uncertainty.
Four Price Doji Candlestick Pattern
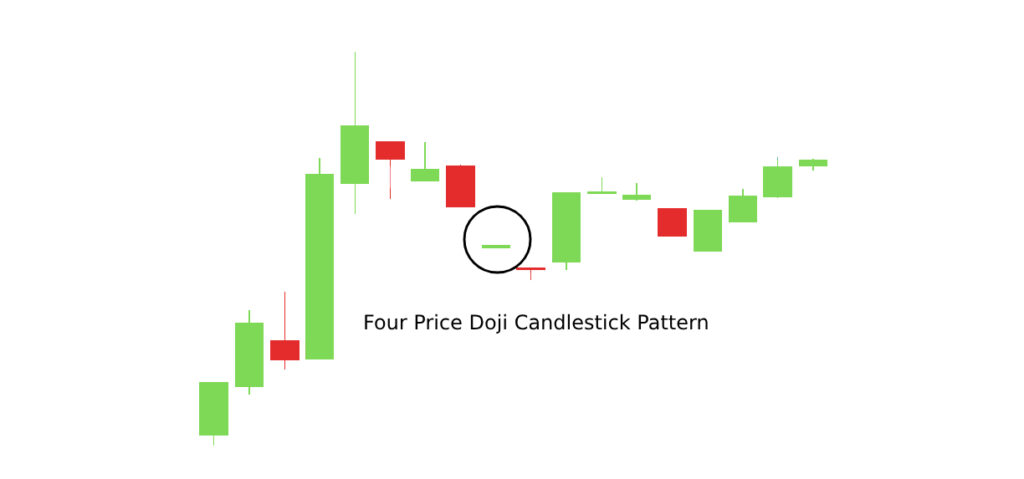
It’s an extremely rare and scarce formation in technical analysis-technical analysis the Four Price Doji candlestick pattern. In this, all the opening prices, closing prices, the high prices, and low prices are the same; hence, it ends in a candlestick that does not have any body or shadows in the body that basically looks like a line. Due to this, it is considered to be rarely seen; hence the Four Price Doji is referred to as one of the powerful signals for indecision on the markets.
Characteristics of the Four Price Doji:
- No Body: The opening and closing prices are the same; thus, there is no body of the candlestick.
- No shadows: the high and low prices are identical too, that is there is no wick or shadow.
- Indecision Sign: The Four Price Doji is a complete indecision sign in the market as both buyers and sellers go into a standstill and the price does not break beyond the opening and closing levels during the trading period.
Bullish Implications:
- Reversal Signal: Four Price Doji often shows a strong indecision of the market and often leads to a reversal. If the pattern appears after a downtrend, it can be an indication that the selling pressure is weakening and that a possible bullish reversal is on its way.
- Consolidation Before Movement Consolidation may also occur ahead of a continuation of a move. If the candlestick is followed by a powerfully bullish candlestick, for example, it may foretell that buyers are becoming ready to thrust prices on their way.
Example:
- Scenario: A Four Price Doji forms at support after a protracted downtrend. Assuming that the following candle is a strong bullish one, it then means that the trend of the downtrend is reversing and a price upwards is in the offing.
- Confirmation: As in all the candlestick patterns, confirmation by the following candle is important. A positive candle after Four Price Doji may indicate a correct trend direction.
The Four Price Doji: How to Trade
- Wait for Confirmation: As the Four Price Doji is an indecision pattern, always wait for a confirming candle to confirm the direction of the market.
- Volume: Search for higher volume on the confirming candle. The more significant the volume, the stronger the likelihood of a price movement in the direction the confirmation suggests.
- Context Matters: This pattern stands more reliable when it formed on significant support levels, usually due to the fact that price tends to have serious difficulty falling and a reversal happens most likely.
The Four Price Doji often displays the market indecisive, that is why one may watch a potential turn to trend or continuation in the consolidation. Indeed, such a pattern formed after a downfall followed by a bullish one has few chances as such. Yet, as this requires some confirmation and additional information on the increase in volume it is much more reliable as compared to the other patterns.
2. Bullish Multiple Candlestick Patterns
Bullish multiple candlestick patterns are powerful formations that appear over several consecutive candlesticks, signaling a potential trend reversal from a downtrend to an uptrend. These patterns are often stronger than single candlestick patterns because of the cumulative effect of multiple candles confirming the shift in market sentiment. Let’s explore some of the most popular Bullish Multiple Candlestick Patterns:
Morning Star Candlestick Pattern:
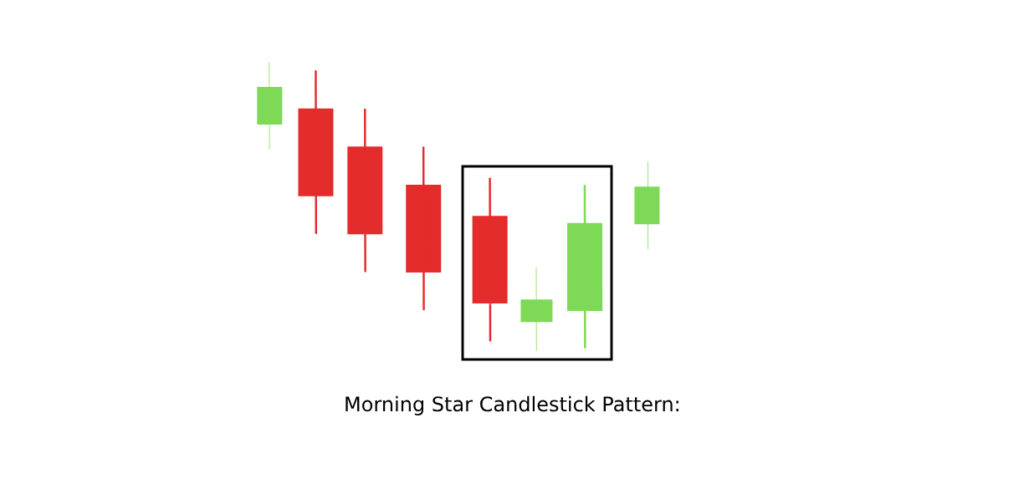
The Morning Star is a well-known Bullish Multiple Candlestick Pattern that typically signals a potential reversal from a downtrend to an uptrend. It consists of three candles and is considered a strong indicator of a market trend change, especially when it appears after a sustained downtrend.
Key Characteristics:
- First Candle: A long bearish (red) candle that confirms the prevailing downtrend.
- Second Candle: A small doji or indecision candle (can be a spinning top, doji, or small-bodied candle), showing that the market is undecided, with both buyers and sellers in a battle for control.
- Third Candle: A long bullish (green) candle that closes well above the midpoint of the first candle, confirming that buyers have taken control, marking the start of a potential uptrend.
Why It Forms:
The Morning Star pattern occurs when the market had been in a strong downtrend and then subsequently exhibited consolidation or indecision (the second candle). The third candle marks that the buyers have gotten stronger, resulting in the change of trend sentiment. This is what is most important – confirmation from the third bullish candle to confirm that the reversal of the trend has taken place.
Trading Tip:
This morning star is more reliable if it forms near significant support levels like previous lows or Fibonacci retracement levels. Moreover, increased trading volume on the third candle lends more credibility to the pattern and the possible reversal that may result.
Example:
- A Morning Star pattern appears after a strong downtrend in the stock price indicates that the market may be turning to the bulls’ side. Trades often utilize this pattern when combined with other indicators like RSI or MACD to validate the bullish sign before a trade is put in place.
If there are identified and appreciated Morning Star Candlestick patterns then traders could better position themselves about a reversal to maximize gain before entering long-term positions.
Bullish Harami Candlestick Pattern:
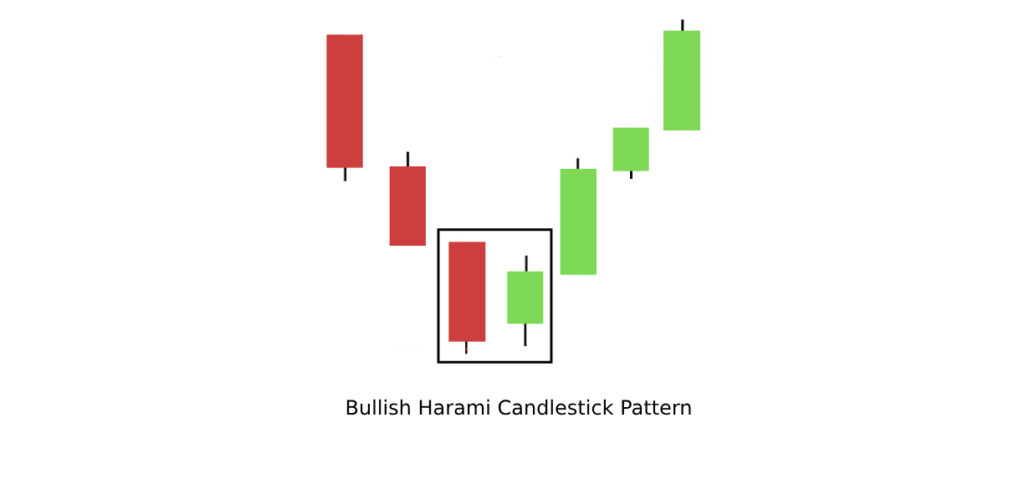
The Bullish Harami is a widely recognized Bullish Multiple Candlestick Pattern that signals a potential reversal from a downtrend to an uptrend. It consists of two candles: the first is a long bearish candle, followed by a small bullish candle that is entirely contained within the body of the first candle.
Key Features:
- First Candle: Long bearish (red) candle representing significant selling pressure and continuation of the downtrend.
- Second Candle: A smaller bullish (green) candle that forms inside the body of the first candle, indicating a potential shift in sentiment as buyers start to exert influence.
Why It Forms:
The Bullish Harami pattern is established when the market had been in a strong downtrend, but the small bullish candle that follows has a sense that selling pressure is losing steam, and buyers are taking charge. The second candle that completely lies within the first one’s range is indicative of indecision in the market before it makes a turn around.
Interpretation
The Bullish Harami is a reversal pattern and is more reliable when it occurs after a prolonged downtrend. It shows that although there was strong selling in the market-the first bearish candle-buyers are stepping in as indicated by the second candle, signaling a potential change in trend.
Confirmation:
To make this pattern more reliable, traders often look for additional confirmation from other indicators or a strong bullish candle following the Bullish Harami pattern. Volume can also give additional confirmation—higher volume on the second bullish candle indicates stronger buyer interest.
Example:
- A Bullish Harami is interpreted as an indication that the downtrend has slowed down, and traders would like to believe more if the pattern has emerged at important support levels or the level of previous lows/moving averages. The third candle has to continue the uptrend before the trader believes a confirmation of the reversal exists before opening a position.
By identifying the Bullish Harami pattern, traders will be able to anticipate the potential for a trend reversal and get into long positions when the pattern indicates that buyers might take control of the market.
Piercing Candlestick Pattern:
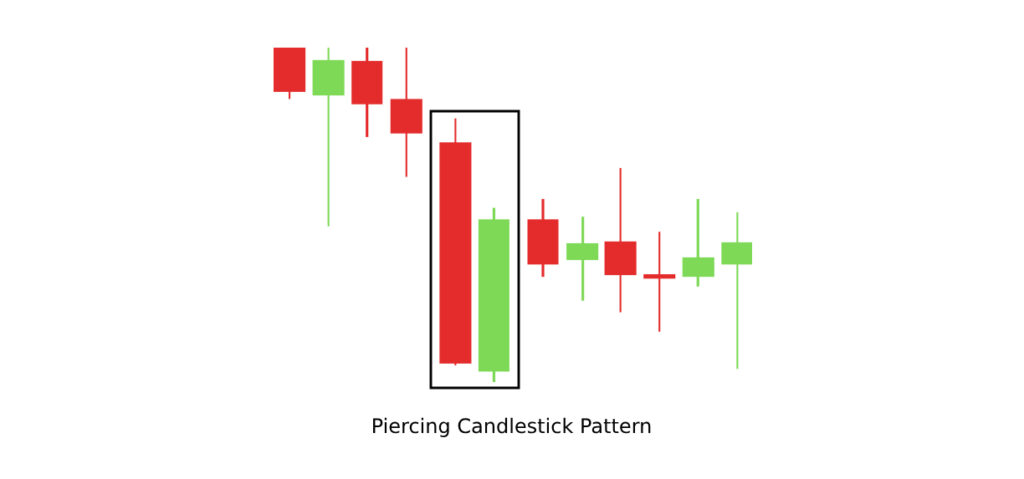
The Piercing Candlestick Pattern is a very popular Bullish Multiple Candlestick Pattern, signaling the potential reversal of a downtrend and the start of an uptrend. This pattern consists of two candles: the first one is a long bearish candle, followed by a bullish candle that opens below the previous candle’s low and closes above its midpoint. The pattern indicates a shift in market sentiment from bearish to bullish.
Key Characteristics:
- First Candle: A long bearish (red) candle representing great selling pressure and continuation of a downtrend.
- Second Candle: A bullish green candle that opens below the low of the first candle but closes above the midpoint of the first candle, suggesting that the buyers are coming in to take control
Why It Forms
The Piercing Candlestick pattern is formed when the market has been in a downtrend and the first bearish candle suggests strong selling pressure. However, the second bullish candle indicates that the selling pressure is weakening and buyers are stepping in, pushing the price upward. The second candle closing above the midpoint of the first candle demonstrates that the bulls have gained strength and that the market sentiment is likely shifting toward a bullish trend.
Interpretation:
The Piercing Candlestick pattern is deemed a bullish reversal pattern and may be interpreted as suggesting that the downtrend could be nearing its end. Its occurrence with the second candle closing above the midpoint of the first candle is the strongest indication that buyers may be taking control and a trend in the upward direction could follow. This is viewed by traders as a market with possible bullish momentum.
Confirmation:
Traders usually wait for confirmation before acting on the Piercing Candlestick pattern. Confirmation may be in the form of a strong bullish follow-through candle or an increase in trading volume. The pattern is more reliable when it appears after a long downtrend and at key support levels, such as moving averages or previous price lows. Confirmation from other technical indicators, such as the Relative Strength Index (RSI) or Moving Average Convergence Divergence (MACD), can also enhance the reliability of the pattern.
Example:
- The Piercing Candlestick pattern often indicates a bearish trend might turn into a bullish one. When it appears at a support level or near other key technical indicators, for example, the 50-day moving average, this makes the signal stronger as it indicates a trend reversal.
The Piercing Candlestick Pattern is widely used by traders to anticipate reversals and identify potential buying opportunities as the market shifts from a bearish phase to a bullish phase.
3. Additional Bullish Candlestick Patterns
Besides the standard Bullish Candlestick Patterns, there are several others that indicate upward price movement and trend reversals. These patterns help traders in detecting buying opportunities and making a quick profit during market rallies. The following are some more Bullish Candlestick Patterns to look out for:
1. Bullish Engulfing
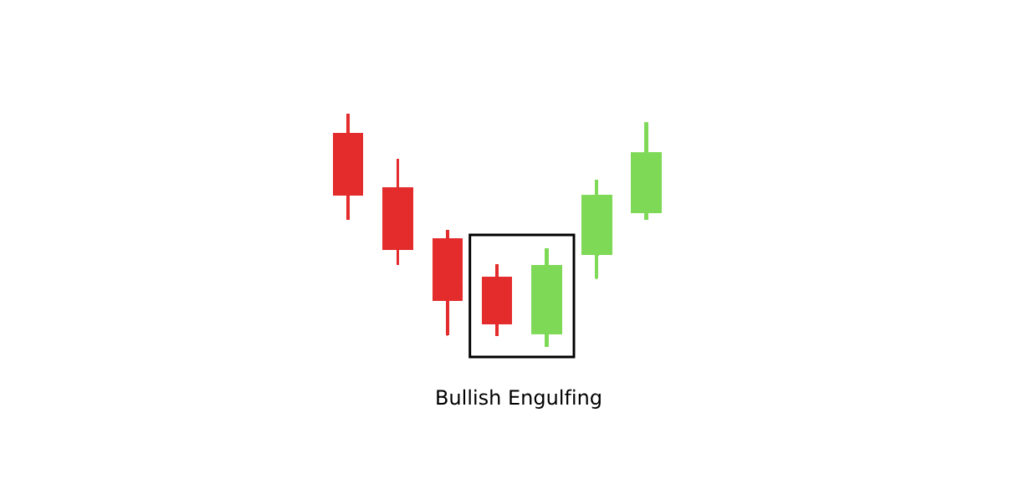
- The Bullish Engulfing pattern is a two candle pattern, which includes a small bearish followed by a larger bullish, engulfing the first candle. This pattern shows shifting towards buying pressure and this pattern indicates that the buyer has overpowered the sellers, making it a strong buy signal for reversal. However, it is more effective when it occurs after a trend or at a support.
2. Three White Soldiers
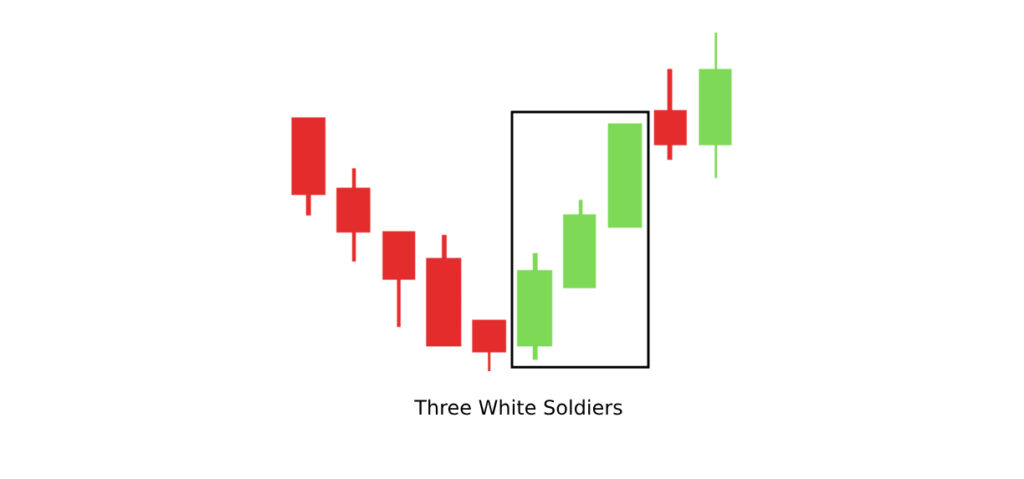
- The Three White Soldiers is a three-candle pattern in which each candle closes progressively higher than the previous one, creating a series of strong bullish candles. It is an obvious signal of a strong bullish trend and indicates that the bulls are in full control. The pattern is often regarded as a reversal from the previous downtrend or the continuation of an ongoing uptrend.
3. Rising Three Methods
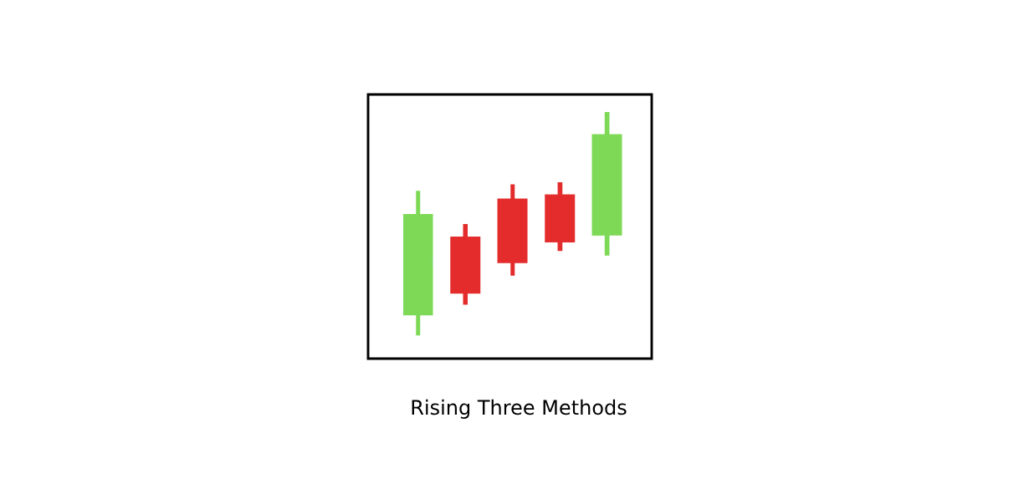
- It’s an important five-candle pattern: Rising Three Methods, with a long white bullish candle followed by three small white candles that hug within the previous bullish candle; finally, with a white bull, meaning this will continue going upwards, suggesting that whatever temporary consolidation is seen there is strength overall to the prevailing trend of being bullish. It confirms, or rather has come into existence to reaffirm that an uptrend that existed and persisted before this pattern did not just simply go away on its own.
4. Tweezers Bottom
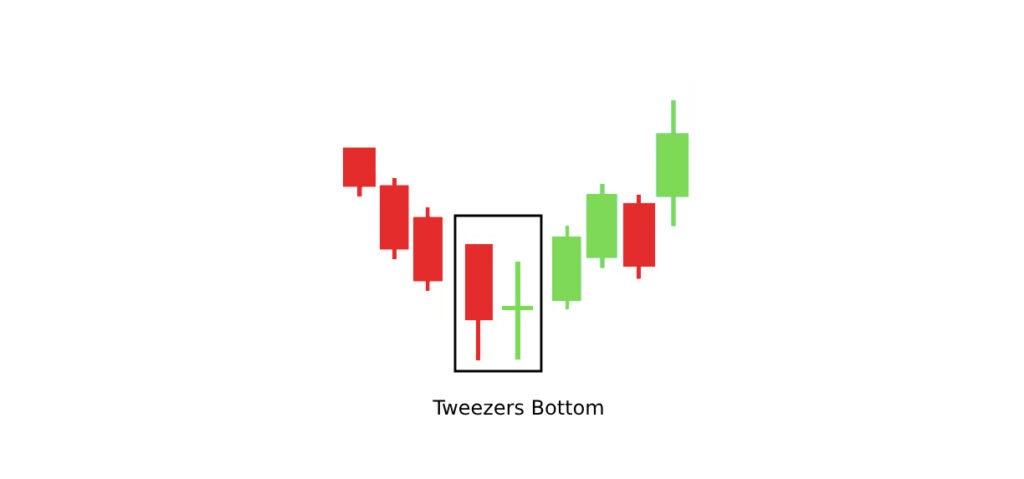
- The two-candle Tweezers Bottom pattern will have both the lows in the same level. A high support level is marked along with a sign that represents the beginning of an upward trend. This usually forms after a downtrend to indicate that sellers have expended their energy. The forming process indicates the pressure for buyers, and an upward turn would be in the near future.
Bearish Candlestick Patterns
Bearish Candlestick Patterns indicate the dominance of sellers, implying that prices might move down. They can be in the form of Single Candlestick Patterns and Multiple Candlestick Patterns, both of which are indicative of different weaknesses in the market or changes in trends. This kind of knowledge helps traders understand potential price drops and selling or shorting opportunities.
1. Bearish Single Candlestick Patterns
Hanging Man Candlestick Pattern:
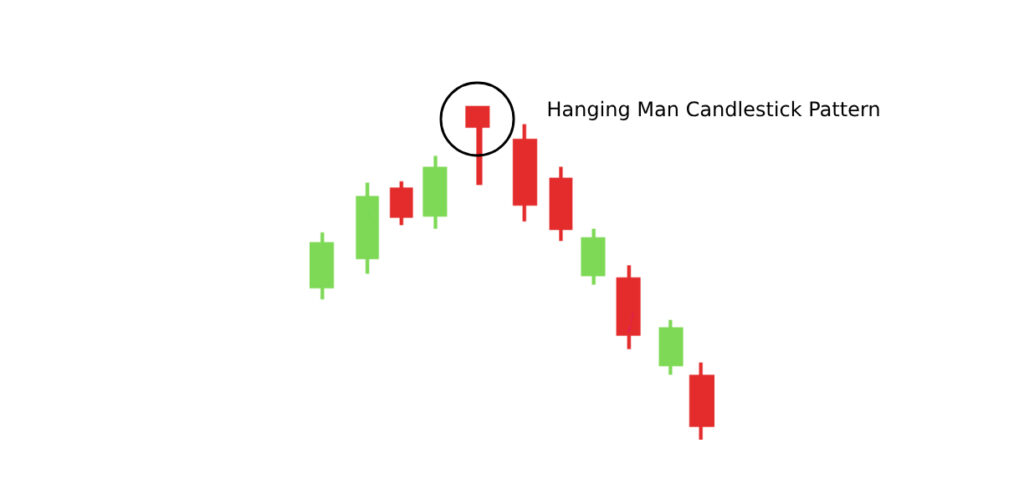
This pattern looks like Hammer candlestick but forms after an uptrend. The Hanging Man is characterized by a small body and a long lower wick, indicating a potential bearish reversal. It suggests that although the bulls were able to force their will through, sellers have begun to dominate the market, showing a potential trend change from bullish to bearish.
Shooting Star Candlestick Pattern:
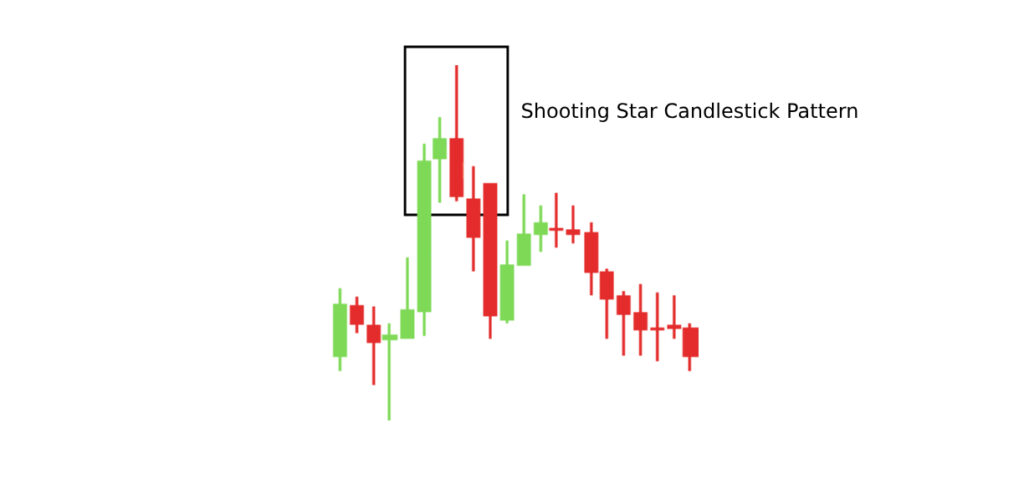
Shooting Star is a single candle with a small body and an elongated upper wick, which forms after the uptrend. This is the bearish reversal pattern where a long upper wick tells us that buyers tried to make the price move up, but they failed, and then sellers took over by pulling the price down. A greater significance is given to the pattern when it is followed by a strong bearish candle.
Gravestone Doji Candlestick Pattern:
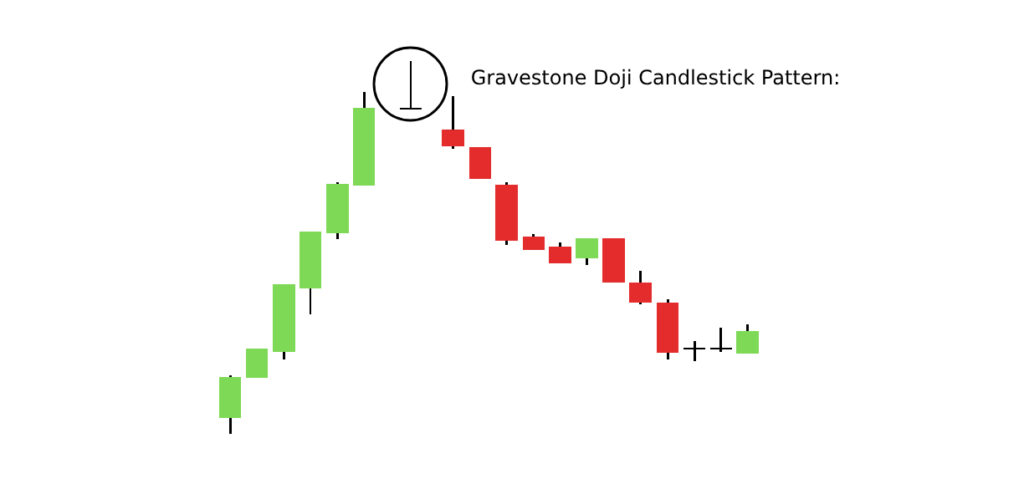
The Gravestone Doji is a bearish pattern that occurs when the price rises significantly during the trading session but falls back to the opening price, leaving a long upper wick. This pattern indicates that buyers initially had control but were overpowered by sellers, which may indicate a potential bearish reversal.
Spinning Top Candlestick Pattern:
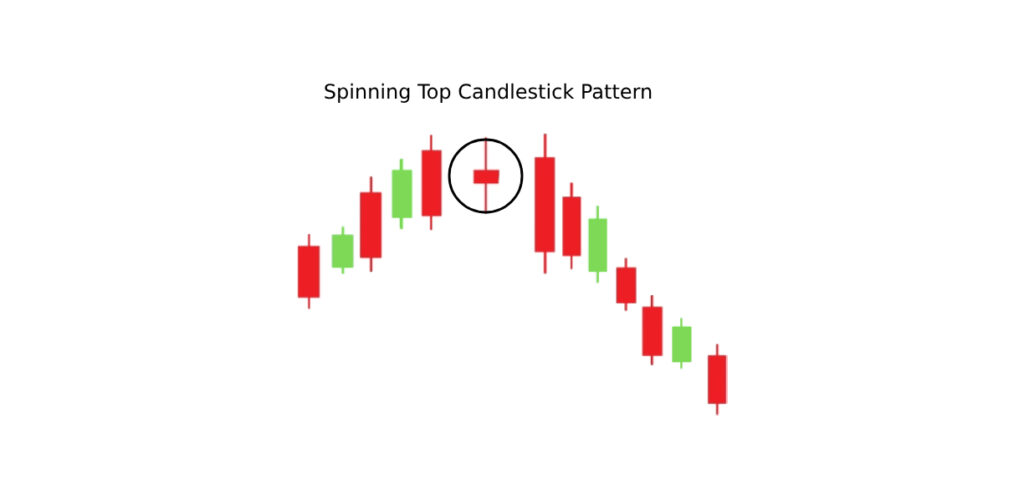
In a bullish trend, the small body with long wicks of a Spinning Top indicates indecision in the market. If it’s followed by a strong bearish candle, it can indicate a downtrend because the market uncertainty shifts towards selling pressure.
Long-Legged Doji Candlestick Pattern:
This pattern has long wicks on both sides of a small body, which is indicative of huge indecision and high volatility. In case it follows an uptrend, the Long-Legged Doji can signal a potential bearish reversal as market participants are uncertain, and sellers may start taking control. This pattern indicates high indecision. If it forms after an uptrend, and followed by bearish confirmation, it may signal a reversal.
Four Price Doji Candlestick Pattern:
This rare pattern shows complete indecision and is often considered a pause. If it occurs after a strong uptrend, it might hint at reversal if followed by bearish confirmation. The Four Price Doji comes when the open, close, high, and low are all the same price, meaning that the total indecision in the market exists. It usually occurs at the end of a trend, pointing to a possible reversal in the current price movement in case it is followed by a strong bearish candle.
2. Bearish Multiple Candlestick Patterns
Evening Star Candlestick Pattern:
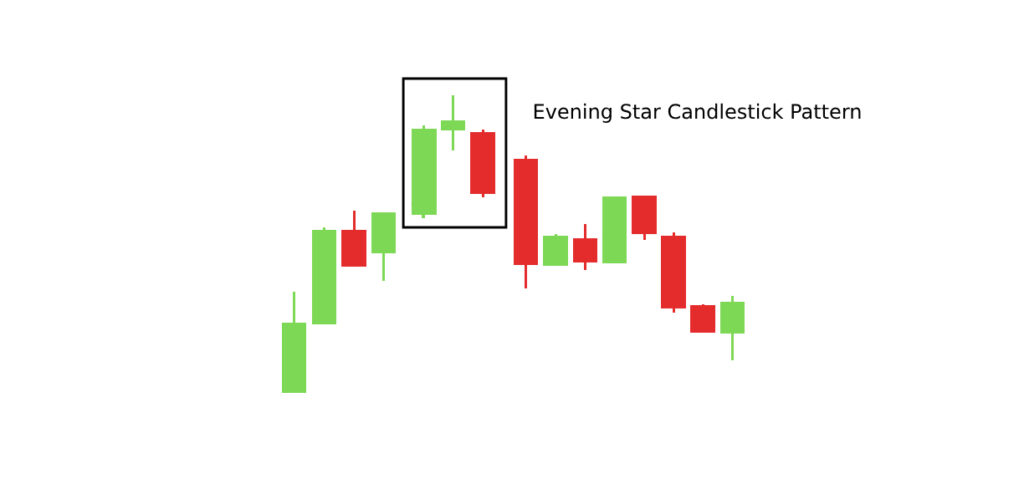
It is a three-candle pattern called Evening Star. The pattern signals a change in the trend from being bullish to bearish. It consists of a large white bullish candle, followed by a small-bodied candle-often a Doji, and the final candle is a long black bearish one closing below the middle point of the first candle. It suggests that the bull momentum is getting weaker and may lead to the sellers gaining the ground and the start of the downtrend.
Bearish Harami Candlestick Pattern:
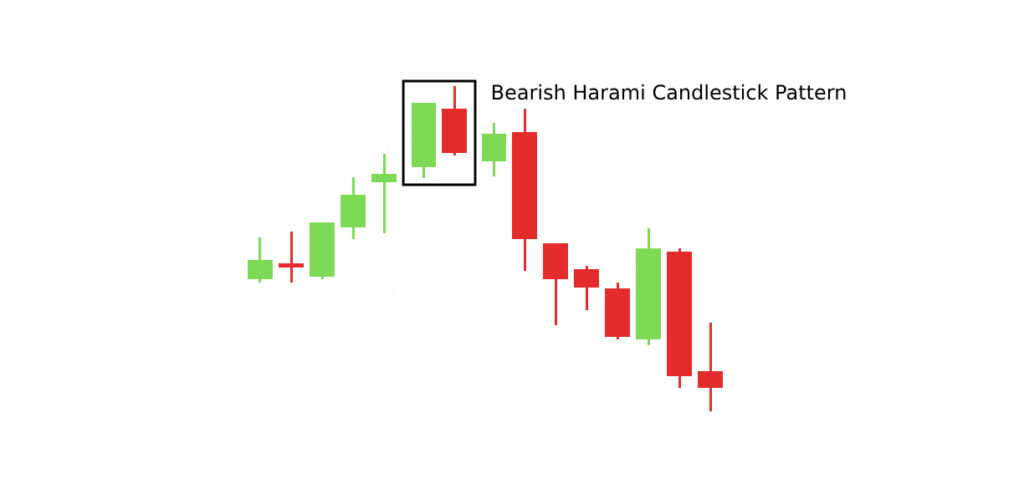
This is when a small bearish candle appears after a big bullish candle. The small candle is engulfed in the range of the previous candle. This pattern implies that the bullish trend is weakening, and a downtrend may be beginning since buyers are not able to support the price upward.
Dark Cloud Cover Candlestick Pattern:
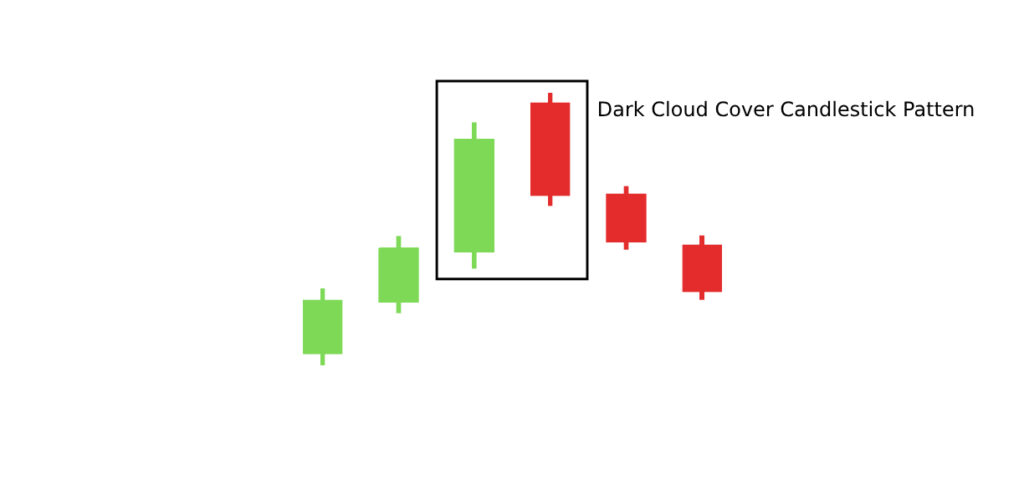
The Dark Cloud Cover is a two-candle pattern where the second candle opens above the first candle’s high but closes below its midpoint. It signals a shift from bullish to bearish sentiment, as it indicates that selling pressure has increased significantly after the first bullish candle, suggesting a possible reversal to the downside.
Three Black Crows Candlestick Pattern:
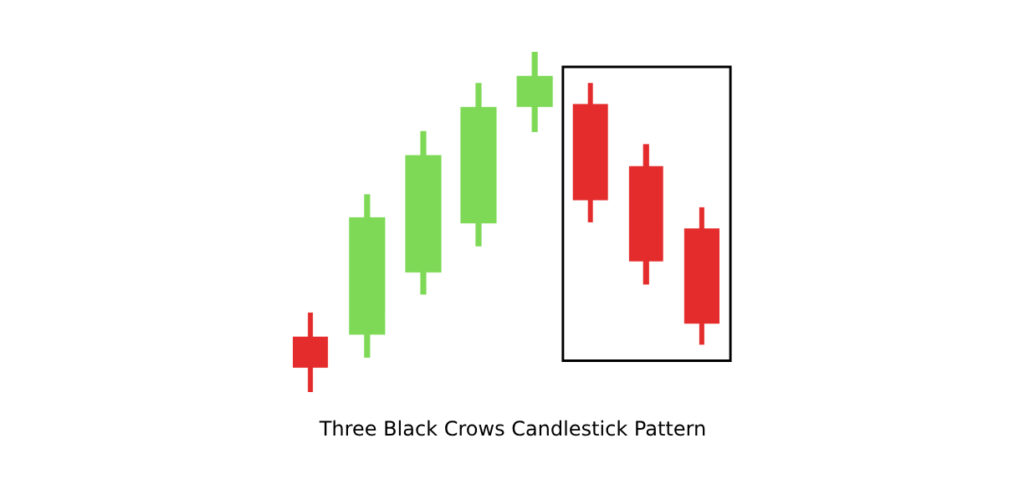
The Three Black Crows is a three-candle pattern in which every successive candle opens higher than the previous one but closes lower. This formation shows a strong bearish trend because of the constant downward movement, indicating that sellers are in control and, therefore, that the downtrend has begun.
Falling Three Methods Candlestick Pattern:
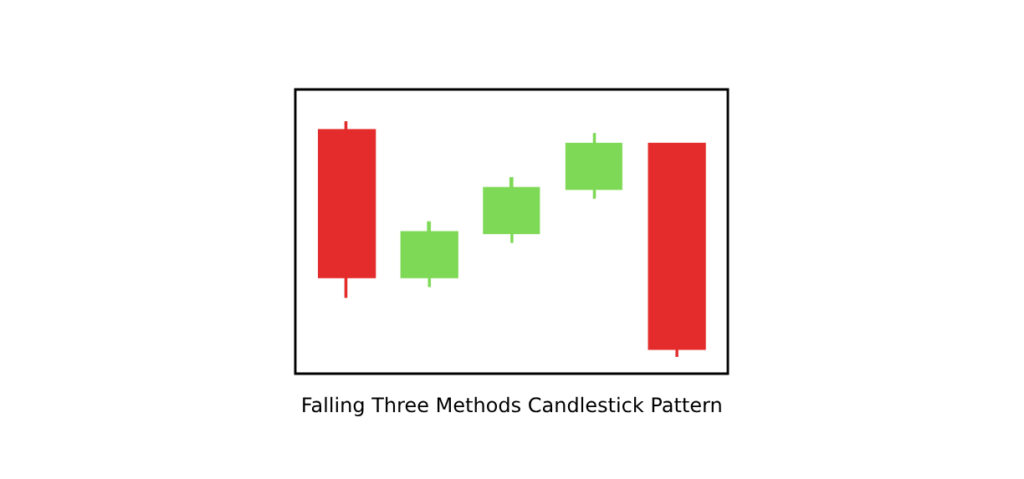
The Falling Three Methods is a five-candle pattern that begins with the length of a long candle – bearish, which contains three small bullish candles. It starts with a long bearish candle, followed by 3 small bullish candles, and ends with another strong bearish candle. This is how one identifies a continuation downtrend, as the size and position of the smaller bull candles do not give this candle enough momentum to continue this downtrend.
Three Inside Down Candlestick Pattern:
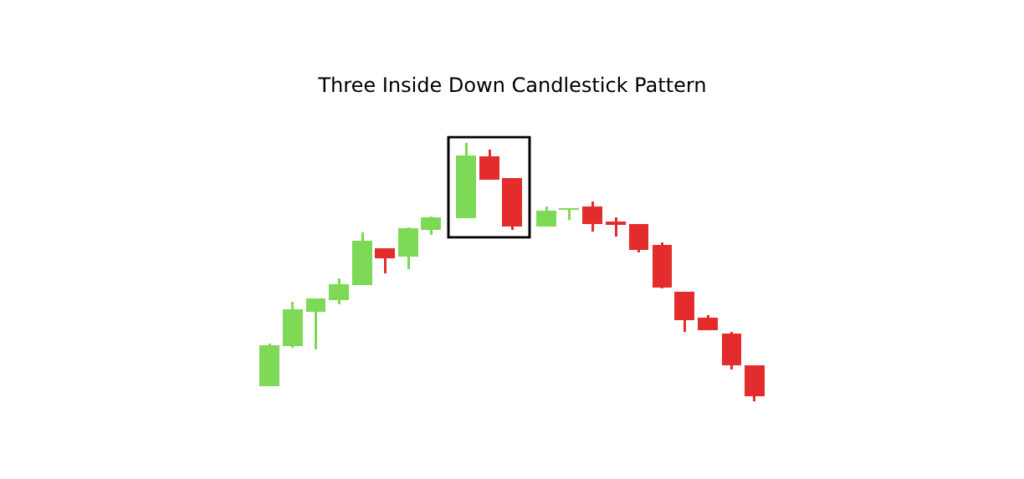
Inside the Three Down Pattern is the bearish reversal formation appearing when a long bullish candle is followed by two inside smaller bearish candles inside the range of the first one. This pattern may indicate a loss of upward momentum and change of market towards a downward trend.
Three Outside Down Candlestick Pattern:
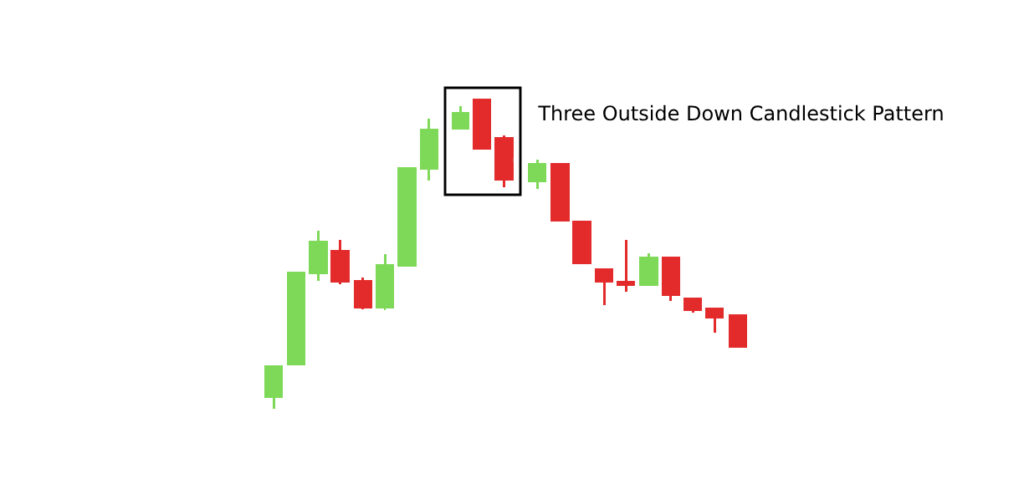
The three outside down pattern has two candles: the first one is a small bullish candle, and the large bearish candle engulfs the first one. That’s a strong bearish reversal because it shows the sellers have overwhelmed the buyers and that a downtrend will follow.
3. Additional Bearish Candlestick Patterns
Other than the common bearish candlestick patterns, there are several other formations that point to a possible market reversal and downtrend. Such patterns help the trader determine the time when selling pressure might increase and give a probable bearish movement in the market. Below are a few additional Bearish Candlestick Patterns that traders must be aware of:
1. Bearish Engulfing
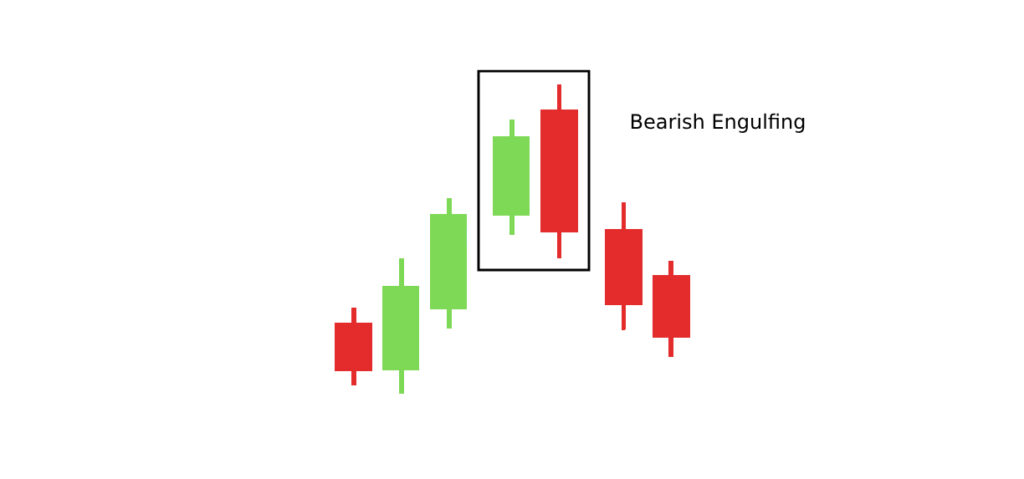
- The Bearish Engulfing pattern is a two-candle formation where a small bullish candle is engulfed by a larger bearish candle. This pattern normally occurs after an uptrend and represents a shift to selling pressure. The bigger bearish candle indicates that the sellers have taken over the momentum of the buyers, signaling the beginning of a potential downtrend. It is commonly seen as a strong reversal signal when it appears at resistance levels.
2. Tweezers Top
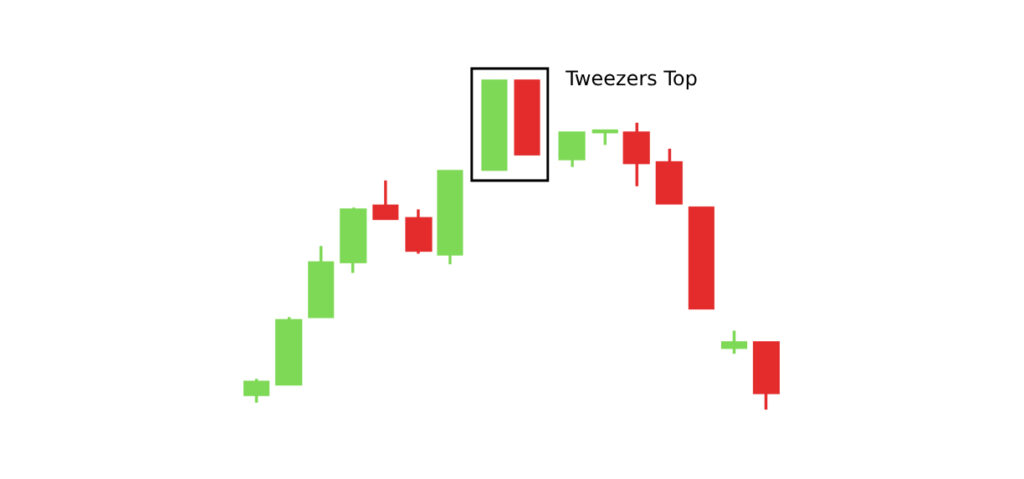
- The Tweezers Top is a two-candle pattern characterized by two candles having equal highs. This pattern forms after an uptrend and shows resistance at a given price level; it gives the impression that the bulls are weakening. The formation indicates that the market has hit a resistance level, and if the price fails to break up, it can reverse. This pattern is significant for marking the start of a downtrend when followed by a strong bearish candle.
Understanding Bullish and Bearish Candlestick Patterns, whether Single or Multiple, is essential for traders seeking to predict market trends and reversals. Single Candlestick Patterns provide quick, immediate insights, while Multiple Candlestick Patterns offer more reliable signals, confirming the strength and direction of market trends. By mastering these patterns, traders can improve their ability to identify potential entry and exit points, enhancing their overall trading strategies.
How to Analyse a Candlestick Chart
In candlestick chart analysis, one of the most essential skills for traders is it helps interpret price movements and predict potential trends in the financial markets. Candlestick charts are a visual representation of price action, which presents open, high, low, and close for every time period. In the process of analyzing a candlestick chart, the patterns and the market sentiment as presented by the candlesticks must be recognized by the traders.
1. The Basics of a Candlestick
A candle consists of a body and wicks or shadows. Body refers to the range within which opening and closing prices were realized during a particular time cycle, and wicks are signs of high and low attained during the period.
- Bullish Candle: A type of candle where the body closes above where it opened during the given period and can be either white or green-colored.
- Bearish Candlestick: A candle with a body that is closing below where it is opening, typically red or black.
2. Determining Key Candlestick Patterns
To start analyzing a candlestick chart, the most important key candlestick patterns are to be identified first. This will help a person gain insight into market sentiments which would help them determine further price movements.
- Single Candle Patterns: These are formation, for example, the Hammer, Shooting Star, and Doji. The hammer may indicate potential reversal while shooting star might hint about trend continuation.
- There are Multiple Candlestick Patterns: Bullish Engulfing, Morning Star, and Three White Soldiers. These patterns can have two or more candlesticks, and they tend to be stronger signals for trends and reversals.
3. Market Sentiment Identification
Every candlestick pattern indicates a change in the market’s sentiment:
- Bullish Sentiment: If a Bullish Engulfing, Morning Star, or Three White Soldiers appears, then it is an indication that buyers are dominant and the prices may move up.
- Bearish Sentiment: Patterns such as Bearish Engulfing, Evening Star, and Three Black Crows indicate that sellers are in control, and a downtrend may occur.
4. Time Frame and Confirmation
Time frame is very important when analyzing candlestick patterns. A pattern on a daily chart might be more reliable than the same pattern on a five-minute chart. In addition, candlestick patterns can be confirmed by other technical indicators, such as RSI, MACD, or moving averages, which can increase the reliability of the predictions.
5. Important Factors in Candlestick Chart Analysis
- Trend Context: Always look at the larger trend in which the pattern appears. Patterns occurring at the end of an uptrend or downtrend are more significant because they often signal a reversal.
- Volume: Volume confirmation can enhance the strength of a candlestick pattern. For instance, a Bullish Engulfing pattern that is supported by high volume is stronger than a similar pattern with low volume.
- Support and Resistance Identify on the chart key support levels and resistance levels. That is, a candle formation near such levels may forecast a strong reversal or the continuation of the trend.
6. Practical Example: Using Candlestick Analysis
For instance, let’s take an example of the Morning Star pattern, a three-candle pattern made up of a large bearish candle, small-bodied candle (often Doji), and a large bullish candle. This is a form of reversal pattern from the bearish side to a bullish one. Confirmation of this pattern would depend on an increase in volume in the third candle and for it to appear near the support level.
Analysis of candlestick charts is a potent approach toward understanding the market action of prices. Recognizing and interpreting both individual as well as multiple patterns can gauge market sentiment, pick possible reversal areas, and help traders foresee future price movements. To achieve successful candlestick analysis, however, a person should be able to exercise by incorporating other technical indicators as conformation. By blending it with a comprehensive trading plan, one can be very confident of one’s decisions and have lessened risks.
Popular FAQs About Candlestick Patterns
Here are some frequently asked questions (FAQs) about candlestick patterns that will help deepen your understanding of this powerful technical analysis tool:
What are candlestick patterns, and why are they important?
Candlestick patterns are formations created by one or more candlesticks in a price chart. They help traders identify market sentiment, trend direction, and potential price reversals. These patterns are crucial because they offer visual cues about whether buyers or sellers are in control, which can assist in predicting future price movements. Popular patterns like Bullish Engulfing, Hammer, and Morning Star provide actionable insights into market psychology.
How is a single candlestick different from multiple candlestick patterns?
Single candlestick patterns consist of a single candle only, such as Doji, Hammer, and Shooting Star, which sometimes hint at a reversal or lack of decision in the market. Multiple candlestick patterns, however, take up at least two candles or more to form, for instance, Bullish Engulfing, Evening Star, or Three White Soldiers, which are regarded to be more reliable since it gives a confirmation of how a trend or reversal might play over multiple periods.
How reliable are candlestick patterns in predicting market movements?
Candlestick patterns are helpful tools in the prediction of market movements; however, the reliability is dependent on various factors. Context of the trend is a critical issue. Patterns near the end of strong uptrends or downtrends often signal reversals, while those in the middle of trends might suggest continuation. Most traders combine candlestick analysis with other indicators, such as volume, RSI, or MACD, for better accuracy and confirmation of signals.
What does the Hammer candlestick pattern indicate?
The Hammer is a one-candlestick pattern that has a small body at the top of the candlestick with a long lower wick. It usually occurs after a downtrend and indicates a potential reversal to the upside. A long lower wick suggests that sellers pushed the price down during the session, but buyers managed to regain control and close near the open. This shows the market’s potential shift in sentiment.
What is the Morning Star pattern, and how is it interpreted?
The Morning Star is a reversal pattern that signals a likely trend reversal from a downward to an upward trend, which is made up of a long bearish candle, followed by a small-bodied candlestick (often the Doji or Spinning Top), and then finishing with a long bullish candle. This pattern is interpreted that the market is changing over from being bearish to one of bullish sentiment, due to the middle candle forming an indecision and confirming the reversal by the long bullish candle.
What is a Bearish Engulfing pattern?
Bearish Engulfing is a small bullish candle engulfed by a larger bearish candle. It means the trend has changed from a bullish to a bearish one. The large bearish candle shows that the sellers are taking control, pushing out the earlier buying momentum. Traders take it as a sell or short the asset.
Can candlestick patterns be used for intraday trading?
Yes, candlestick patterns are popularly used for intraday trading, especially on short time frames like 5-minute or 15-minute charts. Doji, Engulfing, and Hammer patterns can give rapid clues about the reversal or continuation of a trend in one trading day. But one should not rely on just candlestick analysis; they should be used in combination with other indicators for reliable intraday trading signals.
What are Doji candlesticks, and what do they indicate?
A Doji is a candlestick that has an extremely small body where the open and close prices are nearly identical. Doji candlesticks usually represent indecision in the market since neither the buyers nor the sellers have control over the situation. Depending on the situation, a Doji may either indicate a reversal or continuation. For instance, when a Doji occurs following a strong trend, it might mean a reversal, while a Doji within a range might be an indication of consolidation.
How do volume and candlestick patterns interact with each other?
Volume is an essential part of confirming the power of candlestick patterns. A Bullish Engulfing pattern with high volumes of trading confirms strong buying, while a Shooting Star pattern has weak volume, which may act as a false signal when indicating a fall in the prices. Therefore, analyzing this kind of volume with other aspects of candlestick patterns authenticates the validity of such patterns.
Can candlestick patterns be used for long-term investments?
Candlestick patterns are more commonly used for short-term trading and intraday analysis. However, they can be useful for longer-term investors as well when looking for entry or exit points, especially in the context of larger trends. For instance, patterns such as the Morning Star or Evening Star on weekly charts may signal a change in long-term market trends, helping investors better time their positions.
Key Takeaways
- Candlestick patterns are visual expressions of the price action, which shows the market’s sentiment in terms of the trend and potential reversals.
- Bullish patterns point to a future upward movement, while bearish patterns indicate possible downward movements.
- Single candlestick patterns such as Hammer, Shooting Star, and Doji present quick views on potential reversals or indecision.
- The multiple candlestick patterns such as Bullish Engulfing, Morning Star, and Evening Star tend to be more reliable when it comes to the trends and reversals.
- Analysis of candlestick patterns takes into account the structure of candlesticks, key pattern identification, market sentiment detection, and time frame considerations along with volume and support and resistance levels.
- Combining it with other technical indicators can raise the accuracy of predictions so that traders can make an informed decision.
Conclusion
Candlestick patterns are a powerful tool for technical analysis, offering valuable insights regarding market sentiment and potential prices. By understanding the types of patterns and their implications, traders can make more knowledgeable decisions and improve their strategies.
However, it must be remembered that candlestick patterns are not foolproof. They should be integrated with other technical analysis tools, as well as fundamental analysis, to make well-rounded decisions.
With the practice and skill of reading candlestick charts, you can develop your knowledge of market dynamics and improve your chances of winning at trading. Whether it’s bullish candlestick patterns, bearish candlestick patterns, or multiple candlestick patterns, mastering these formations can give you a big edge in the market.